


“Energy can never be created, nor destroyed; it can only be changed from one form to another.”The first law of thermodynamics remains a quiet scientific truth despite a broken supply of crude oil due to the ongoing Middle East crisis. As geopolitical disruption tightens its grip around the Strait of Hormuz, that law reads less like classroom physics and more like a warning. The oil is still there, in the reservoirs beneath Kuwait, Iraq and the Emirates. What has changed is whether the crude oil can move without disruption.The disruption in the Middle East has exposed a deeper fault line in global oil markets. For India, it’s significant because the country imports nearly 90 per cent of its crude oil requirement. With roughly 50 per cent of its crude imports transiting the Strait of Hormuz, according to S&P Global Commodities at Sea data, India now finds itself at the intersection of simultaneous pressures: a disrupted supply route, a changing import mix since it began unwinding Russian crude purchases. According to the government, the supply is sufficient to cover 60 days of consumption.In a telephone call on March 21, 2026, Vinay, a professional working in NAPESCO, Kuwait-based upstream drilling support services, originally from eastern Uttar Pradesh described conditions on the Kuwait’s coast. “Operations are disrupted. Only about 30 per cent of employees are coming to the office. Offices have taken all safety measures, including fire safety, after the missile attack. The fire safety team can reach any office within 2-3 minutes ,”he told TOI. This disruption has changed the language of the market. The focus is no longer limited to supply and demand. It is about resilience, rerouting and the ability to sustain flows through disruption. In that recalibration, pricing benchmarks, refining systems and national strategies are being tested simultaneously.In March 2026, global crude flows through the Strait of Hormuz – the world’s most critical oil transit chokepoint–collapsed dramatically, triggering a chain reaction across markets. According to the International Energy Agency (IEA), nearly 20 million barrels per day (mb/d) of crude and petroleum product flows have been disrupted, while global oil supply is projected to fall by around 8 mb/d in the same month.
Not all oil is the same: The chemistry that sets the price
The first thing to understand about crude oil is that it is not a single substance. It is a complex mixture of hydrocarbons, and where a crude sits on that spectrum determines who buys it, at what price, and what can be made from it.Two measurements define any crude at the wellhead. The first is API gravity, a density scale developed by the American Petroleum Institute. Light crude, above 31 degrees API, flows easily and naturally yields a high proportion of petrol and jet fuel when refined. Heavy crude, below 22 degrees API, is viscous, requires more processing energy and tends to produce larger quantities of lower-value residues unless the refinery is specifically built to upgrade them.
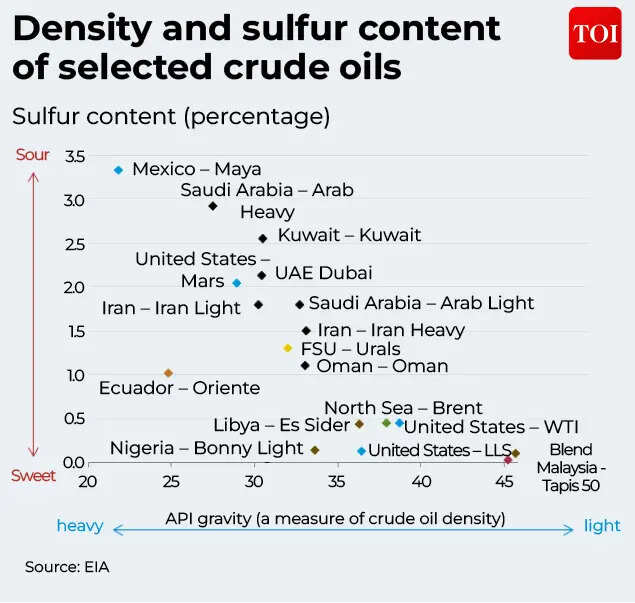
The second is sulphur content. Crude with less than 0.5 per cent sulphur is called sweet; it meets clean-fuel standards at a lower refining cost and commands a price premium. Crude above that threshold is called sour; it requires an additional desulphurisation stage before it can meet Euro-VI standards, and it trades at a discount. That discount has historically ranged from three to fifteen dollars per barrel depending on market conditions, according to S&P Global Commodity Insights.The Middle East produces primarily sour, medium-density crude. North Sea and North American shale formations tend to yield light, sweet grades. This is a geological fact that no trade agreement can change, and it explains much of why the global oil market is structured the way it is.
The Three Benchmarks: Brent, WTI and Dubai/Oman
With hundreds of crude grades traded globally, markets need reference prices. Benchmarks serve this function: widely traded, transparent contracts whose prices become the starting point for pricing almost every other grade as a premium or discount.Brent Crude, produced from a blend of North Sea fields known as BFOET (Brent, Forties, Oseberg, Ekofisk, Troll) and traded on the Intercontinental Exchange in London, is the world’s primary benchmark. ICE data indicates that Brent underlies the pricing of approximately two thirds of globally traded crude. Its authority rests on a structural quality: Brent cargoes are seaborne. Oil loaded at a North Sea terminal can reach any refinery in the world, making its price a genuine reflection of global supply and demand rather than regional logistics.
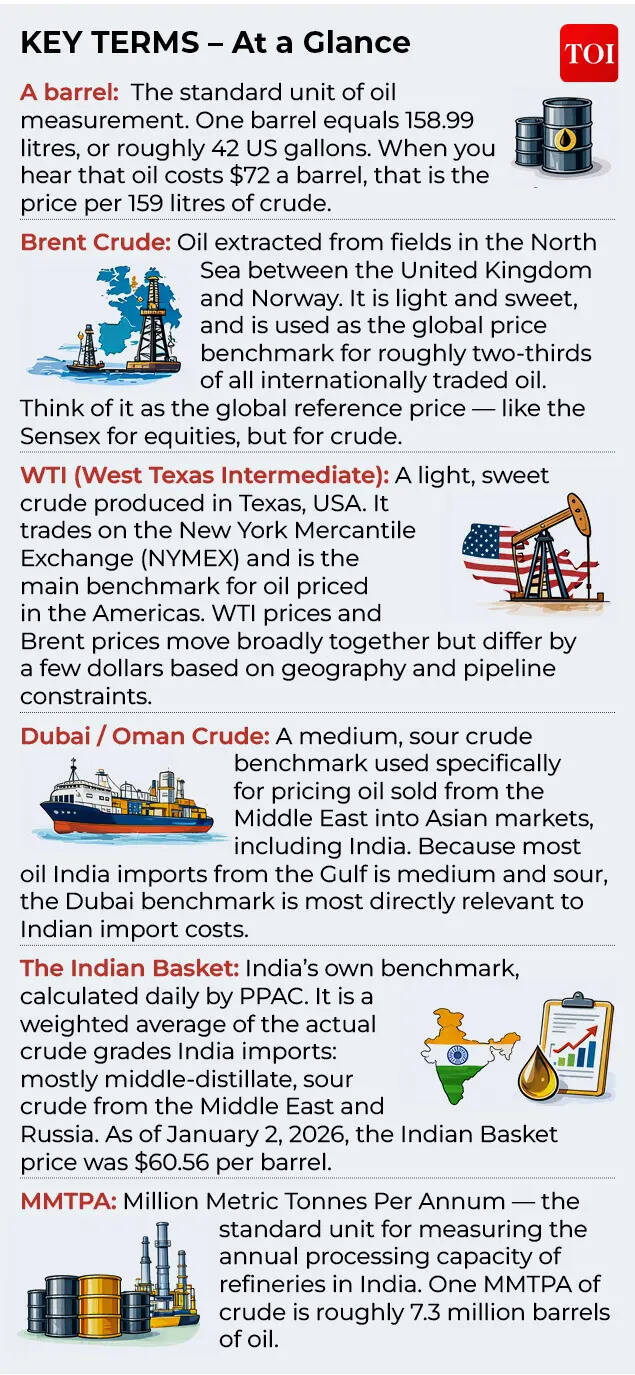
West Texas Intermediate (WTI), traded on the NYMEX at Cushing, Oklahoma, is the primary US benchmark. It is marginally lighter and sweeter than Brent. But WTI is landlocked, its price reflects pipeline capacity and storage constraints at Cushing as much as global market conditions. When US shale output surged between 2012 and 2019, Cushing storage repeatedly filled, pushing WTI prices well below Brent even as world demand climbed. The US Energy Information Administration reports American crude production now exceeds 13 million barrels per day, making the United States the world’s largest producer, yet WTI’s geographic constraint has not fundamentally changed.Less visible in Western financial coverage but essential to Asia is the Dubai/Oman average, the benchmark for the sour, medium-density crude that flows east from the Gulf. It is the price marker against which more than three quarters of India’s imported crude is contracted. The Brent-WTI spread and the Brent-Dubai differential are among the most closely tracked numbers in the global energy trade, each reflecting a different kind of market signal.
How oil travels: Upstream, Midstream, Downstream
Every barrel of crude passes through three stages before it becomes a usable fuel. Understanding which stage is currently under the most stress is essential to understanding what is happening to prices in March 2026.
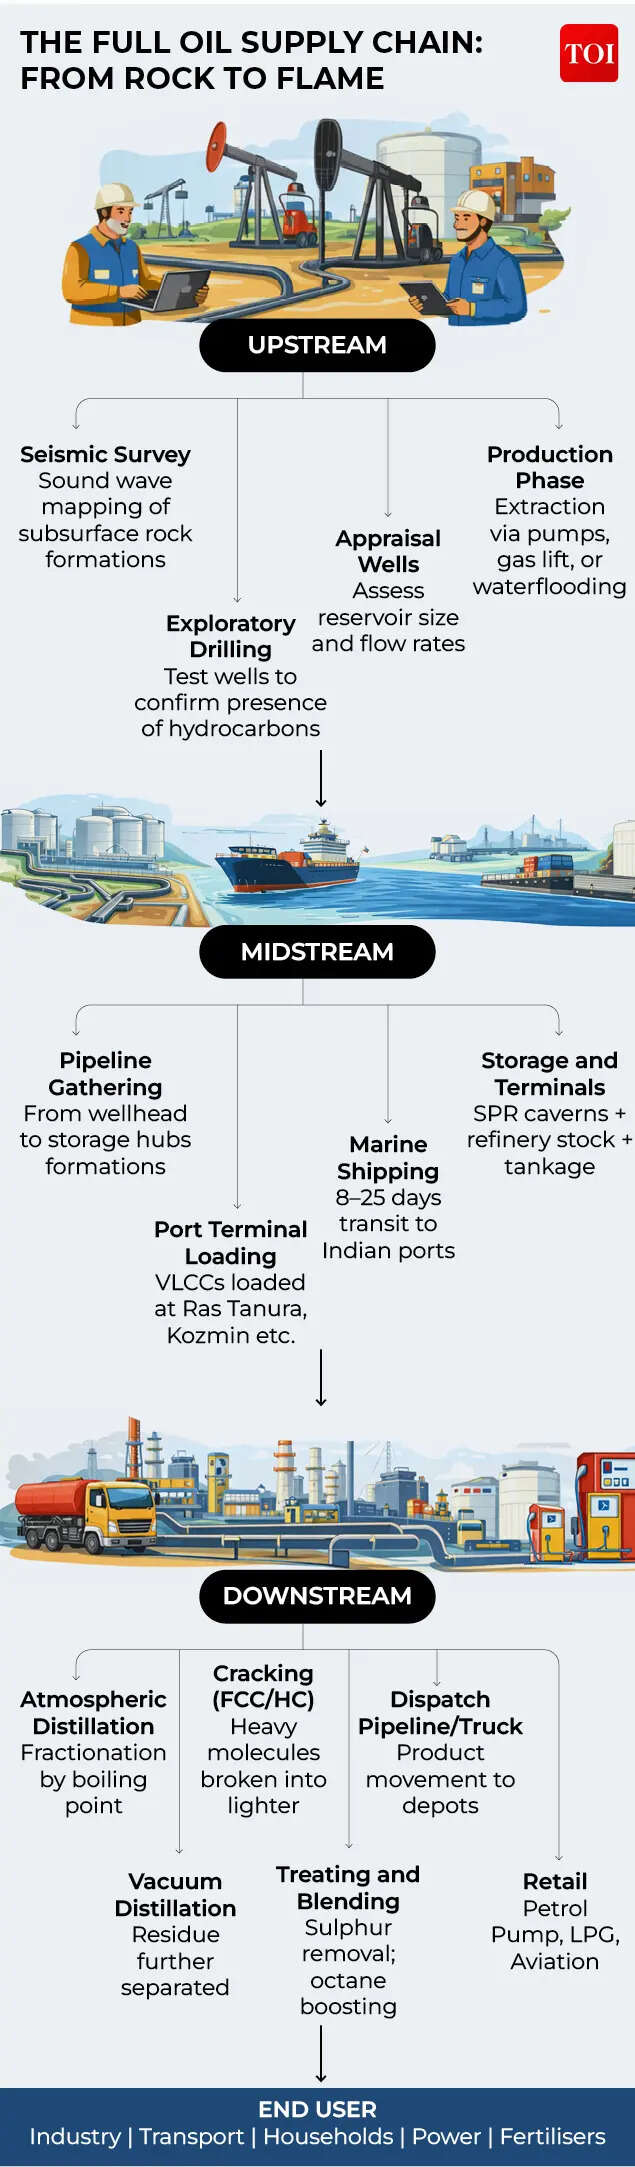
Upstream is exploration and production. It covers geological surveys, drilling rigs and wellheads. In India, ONGC and Oil India are the principal domestic producers, but their combined output in FY 2024-25 amounted to approximately 29 million metric tonnes, covering barely 11 per cent of national consumption, according to PPAC. The remainder must be imported.Midstream is transportation: the pipelines and tankers that carry crude from wellhead to refinery gate. The most critical single point in the global midstream system is the Strait of Hormuz, a waterway 33 kilometres wide at its narrowest, between Iran and Oman. The EIA estimates that roughly 20 per cent of all global petroleum liquids pass through it each day. No pipeline bypass currently operates at adequate scale.
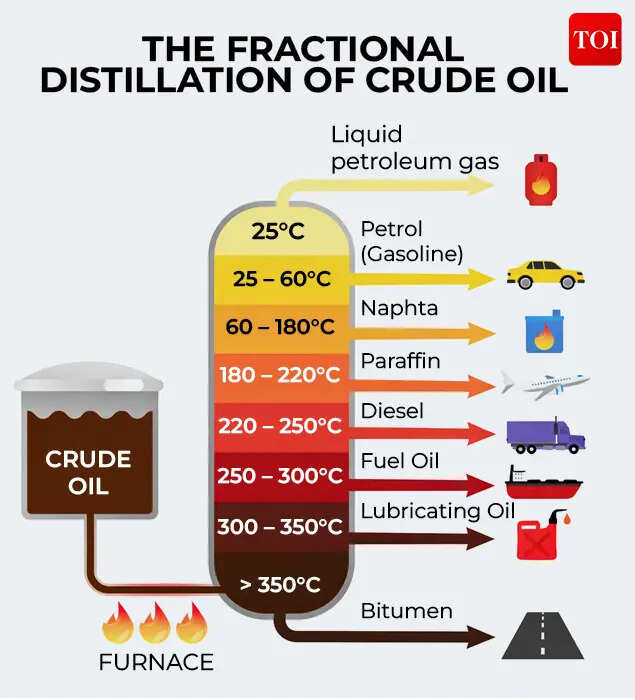
Downstream is refining and distribution, where crude is separated through fractional distillation and then upgraded by processes such as fluid catalytic cracking, hydroprocessing and coking into the product slate that consumers actually use: petrol, diesel, aviation fuel, LPG and petrochemical feedstocks. The complexity of a refinery, measured by the Nelson Complexity Index, determines what grades it can process and how profitably. It is in the downstream that India has invested most deliberately over the past quarter century.It is the midstream layer, the movement of oil, that has come under the most severe strain since late February 2026.
OPEC, OPEC+ and the limits of Coordination
The volume of crude entering the global midstream system each day is not purely determined by geology. Since 1960 it has been partly managed by collective decision.The Organization of the Petroleum Exporting Countries, or OPEC, founded in Baghdad and currently comprising 12 members including Saudi Arabia, Iraq, Iran, Kuwait and the UAE, coordinates production levels among its members to influence price stability. In 2016, facing a market flooded by American shale oil, OPEC extended this coordination to include Russia and nine other non-member producers, creating OPEC+. The expanded group now accounts for roughly half of global production.OPEC+ production from the Middle East stood at approximately 29.1 million barrels per day in the first quarter of 2026, down from 30.2 million in 2024, according to the IEA. Total global production was approximately 100.4 million barrels per day in Q1 2026, up from 97.4 million in 2024 — a figure that reflects rising non-OPEC output from North America and Latin America even as Middle East output has tightened.The cartel’s pricing power is structurally constrained by competitive production elsewhere. North America produced approximately 28.6 million barrels per day in Q1 2026. American output alone exceeds 13 million barrels per day, making the United States the world’s largest single producer, according to the EIA. When OPEC+ restricts supply and prices rise, American shale drilling has historically accelerated within months, partially offsetting the cut. In the current crisis, however, the constraint is not production quota –it is transit.
Source: International Energy Agency, Oil Market Report March 2026. mb/d = million barrels per day.
The Indian Basket
The Indian basket is not a fixed benchmark but a dynamic measure of the country’s actual crude procurement. India buys a mix of crude grades through contracts with multiple producers, and the Petroleum Planning and Analysis Cell (PPAC) calculates a weighted daily average based on realised transaction prices. The Indian basket, therefore, is a record of cost rather than a traded market price.According to PPAC’s methodology notes, the basket currently comprises 78.71 per cent sour grades, represented by the Oman and Dubai average and 21.29 per cent sweet grades linked to Brent dated prices. This composition reflects the crude actually processed in Indian refineries and is derived from the proportion of high-sulphur and low-sulphur crude in total refinery throughput. The tilt toward sour crude is a deliberate strategic choice built on refining economics. A complex refinery equipped with vacuum distillation units, fluid catalytic crackers, hydrotreaters and coking units can buy discounted sour crude and still produce Euro-VI compliant petrol and diesel. The capital investment required is substantial, but a sustained three to fifteen dollar per barrel discount on sour crude, realised over decades of throughput, justifies it commercially. India has been building this refining complexity methodically since the early 2000s.
India’s refinery networks
India operates 23 refineries with a combined capacity of approximately 256.8 million metric tonnes per annum (MMTPA) as of April 2025, according to the Ministry of Petroleum and Natural Gas.
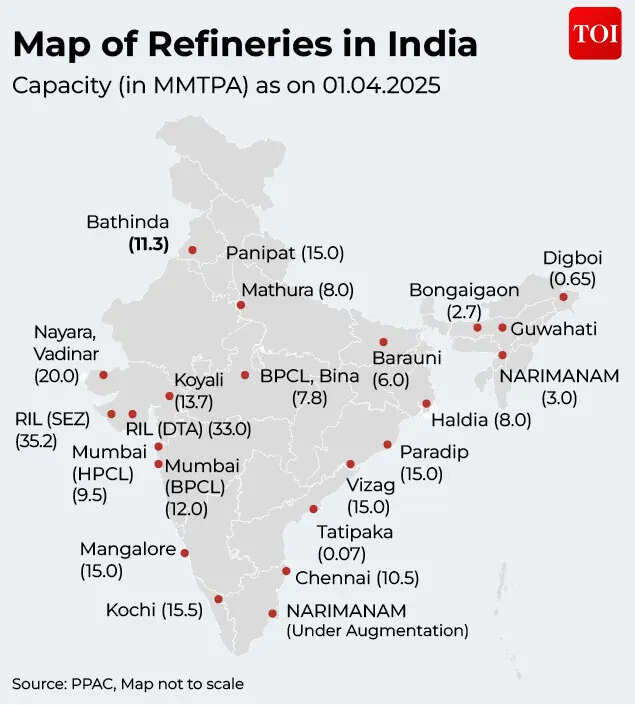
The concentration along India’s western coastline is deliberate. Imported crude arrives at sea terminals in Gujarat, Maharashtra and Karnataka, feeding the large coastal complexes directly. The largest single site is Reliance Industries’ Jamnagar complex in Gujarat, where the SEZ and DTA units together exceed 68 MMTPA, making it the largest refining concentration at any single location in the world. IndianOil operates refineries at Panipat and Mathura in the north, Haldia on the east coast, and at Paradip in Odisha. BPCL and HPCL anchor refining in Mumbai and other urban centres. In the northeast, smaller refineries at Numaligarh, Guwahati, Digboi and Bongaigaon serve legacy producing fields and regional demand.In February 2026, Indian refineries processed 21.9 million metric tonnes of crude, of which nearly 20 MMT was imported, according to PPAC’s monthly report.
When the import bill becomes a problem
The economic transmission from a disrupted Strait of Hormuz to an Indian household is neither immediate nor simple, but it is real, and it moves through several channels simultaneously.The first is the import bill. India spends more on crude oil imports than on any other single import category. A sustained rise in the Indian basket price directly widens the current account deficit and exerts downward pressure on the rupee. A weaker rupee makes oil imports more expensive still, compounding the pressure in a feedback loop that is well understood by Indian policymakers but a challenge to deal with once it gains momentum.With the Indian basket at $111.93 and pump prices unchanged, state fuel retailers –IndianOil, Hindustan Petroleum and Bharat Petroleum – are losing approximately Rs 24 on every litre of petrol sold and Rs 30 on every litre of diesel, according to TOI. The Centre on Friday (March 27) slashed the special additional excise duty on both petrol and diesel by Rs 10 per litre each– a decision that will cost the exchequer an estimated Rs 1.3 lakh crore. At the same time, it imposed export duties: Rs 21.50 per litre on diesel and Rs 29.50 per litre on aviation turbine fuel, designed to capture windfall gains from Indian refiners exporting into a tight global product market. The windfall tax is expected to recover approximately Rs 1,500 crore in the first fortnight, partially offsetting the excise cut. Pump prices, critically, remain unchanged.“In view of the ongoing and evolving situation in West Asia, our government has resolved to provide relief in the form of a significant reduction in excise duties on petroleum and diesel so as to ensure stable prices.” said Finance Minister Nirmala Sitharaman, Rajya Sabha
Going forward, we will continue to ramp up our efforts in mobilising additional non-tax revenues, and our government will remain on its toes to carefully manage the country’s fiscal position.
Finance Minister Nirmala Sitharaman, Rajya Sabha (March 28)
In a S&P Global report citing Jefferies research note on the Strait of Hormuz disruption, which said that every $10-per-barrel rise in crude prices above $80, if passed through to consumers, could lift the Consumer Price Index by 20–25 basis points.“If the government absorbs the increase through an excise duty reduction instead of passing it on, the same quantum falls on the fiscal deficit. Neither outcome is comfortable,” the note said.However, the ministry of Petroleum and Natural Gas, in its statement of March 26, offered a more detailed official picture: against a total reserve capacity of 74 days, actual availability currently stands at approximately 60 days – accounting for crude stocks, refined product inventories and the three underground strategic petroleum reserve sites at Visakhapatnam, Mangaluru and Padur in Karnataka, which hold a combined 5.33 million metric tonnes, or roughly 9 to 10 days of consumption at current rates. There are no comparable strategic reserves for natural gas.“India’s petroleum and LPG supply situation is fully secure and under control. There is no shortage of petrol, diesel, or LPG anywhere in the country,” the ministry stated, calling India “an oasis of energy security” that supplies refined fuel to more than 150 countries. It described reports of shortages and panic buying at filling stations as “a deliberately mischievous, coordinated campaign of misinformation.“The broader worry, as Priyanka Kishore of Singapore-based Asia Decoded notes, is the nature of a protracted disruption. An affordability problem, higher prices absorbed by government or consumers is a familiar challenge, one India has navigated through multiple oil price cycles since 2002, cited S&P Global. An availability problem where supply physically cannot reach refineries is categorically different. It implies production cutbacks, product shortages and, in extremis, demand rationing. India has not faced that scenario in the modern era of its refinery build-out.The government’s current posture rests on three foundations: diplomatic negotiations with Iran that have secured transit access for Indian-flagged vessels, active sourcing from 41 alternative suppliers, and fiscal intervention to hold pump prices while exporting windfall taxes back into the system. For now, refineries are running. Tankers are being rerouted. The government is watching its reserve cover. But the situation is fast evolving, and remains uncertain globally.